After 2008 financial crisis pass over 10 years, however everybody asking what would source of next recession or solution elements.We can see that last four decace global bond market yield graph had not changed anything , as I can see currently its inflexes point has not arrived yet and we have to wait for global yield environmnet era. For a meantime we need to get over the current situation and reach our financial goal.
In my following financial report I intend to analyze the bond market and future expected trend to see where we are a head. Some of you may respond immediately that we are a head of the bottom or resistant (for those who are technical analyst). Partially all of you has a correct answer however the question is what is the bottom/resistant. Is it 0 (zero) or would have been lower. In my point of you Zero level is only a reference point which would no any relationship with bottom or resistant. However if this is the real case which more and more data are proving us it would come into a new era of bond market.
I can see that mid-term (3-9 years) bond market can not see significant changes including bond yield increment or at least from the time global population growth rate will start to increase.As you can see on the 1. Chart [1]annual growth rate of global population between 1970-2018 decreasing without any doubt linearly.As you can see at 1970 growth rate was above 2% but in 2018 the growth rate only 1.11% and the trend is highly reliable (R=0.9468) and does not seems it going to be the inflexion point soon. But definiately one of the first important sign before global bond yield would start to increase after 40 years.
- Chart

Along with population growth decrement , also hand in hand decreasing the global risk free nominal interest rate.I mentioned ’global’ because there is some country which would need to or try to change the nominal risk free interest however within the foreseeable future in most of the country the trend would not going to change.In the next 2 graphs you would be able to see how strong the relationship between riskfree bond market and the population growth as I mentioned before.
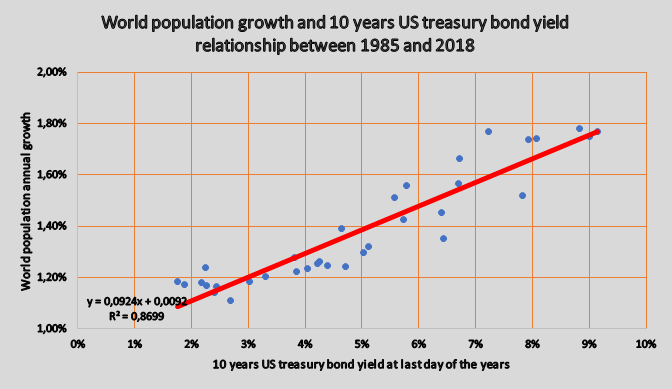
In the 2. Chart you will see the relationship between world population growth rate and the 10 years US treasury bond yield between 1985 and 2018.The relationship is very stong which show the R2 = 0.8699, which is nearly perfect relationship.
2. Chart

Likewise, you would see same and even stronger relationship between global population growth rate and Japan 10 years nominal goverment bond yield.
3. Chart

Last but not least another graph will highlight the valid concern that population growth and global long term (10 years) government bond yield would continuous to go down if population growth rate continuous to slowing down unless otherwise a special even will occur which would cause the inflation point of the long term trend, including but not limited (global) monetary policy changing, (global) population growth rate increase by government interaction, people mentality and investment attitude will change.
Lastly have a look at population growth relationship and 10 years German bond yield last 28 years relationship on 4. Chart. As you will see the relationship is still similar strong as you could see in case of Japan & US.
4.Chart

[1] Data source from https://fred.stlouisfed.org/series/SPPOPTOTLWLD